
|
| Our subscribers' grade-level estimate for this page: 2nd - 3rd |
| Research Reports Cloze Activities |
EnchantedLearning.com Graphic Organizers |
Essay Topics Writing Activities |
| Star |
Spider |
Fishbone |
Cloud |
Tree |
Venn |
Pie Chart/ Circle Graph |
Story Map/ Book Report |
Math |
Many More... |
| More Math Activities | Math Graphic Organizer Diagrams | Math Label Me Printouts |
 Many types of graphic organizers are useful for doing math, including Venn Diagrams (two or three overlapping circles used to compare and contrast sets, and to find lcm and gcf), circle graphs (also called pie charts), trees (to find factors and assess probabilities), charts, and tables.
Printouts:
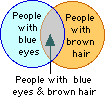
Venn Diagrams (The English mathematician John Venn invented the Venn diagram in 1880.):
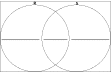
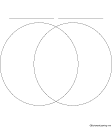 2-Set Venn Diagram Printout A Venn diagram with two sets. |
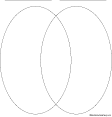 2-Set Venn Diagram Printout A Venn diagram with two oval-shaped sets. |
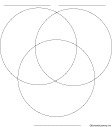 3-Set Venn Diagram Printout A Venn diagram with three sets. |
 Venn Diagram Label the subsets of a Venn diagram. Answers |
 Primes, Even Numbers and Multiples of 3: Venn Diagram Printout Where do the numbers 2, 3, 4, 5, 6, 7, 8, 9, 10 belong on this Venn diagram? For the answers, click here. |
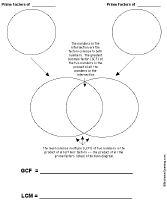 LCM, GCD Factor two numbers into primes, then use a Venn diagram to compute their Least Common Multiple (LCM) and Greatest Common Divisor (GCD). Or go to an example of how to use this diagram. |
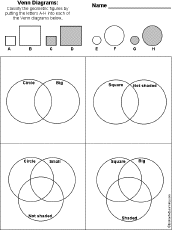 Venn Diagram Printout #1 On this printout, the student classifies geometric figures by shape, size, and shading by placing them in Venn diagrams. Or go to the answers. |
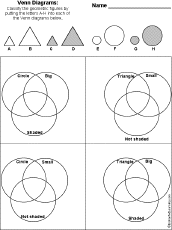 Venn Diagram Printout #2 On this printout, the student classifies geometric figures by shape, size, and shading by placing them in Venn diagrams. Or go to the answers. |
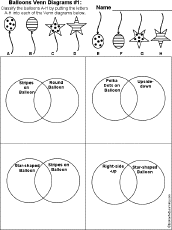 Balloons Venn Diagram Printout #1 On this printout, the student classifies balloons by placing them in Venn diagrams. Or go to the answers. |
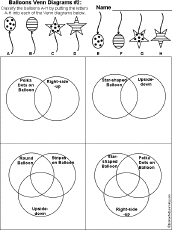 Balloons Venn Diagram Printout #2 On this printout, the student classifies balloons by placing them in Venn diagrams. Or go to the answers. |
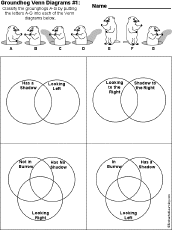 Groundhog Venn Diagram Printout #1 On this printout, the student classifies groundhogs by their shadow direction, the direction they're facing, and whether or not they're in a burrow, by placing them in Venn diagrams. Or go to the answers. |
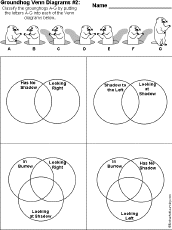 Groundhog Venn Diagram Printout #2 On this printout, the student classifies groundhogs by their shadow direction, the direction they're facing, and whether or not they're in a burrow, by placing them in Venn diagrams. Or go to the answers. |
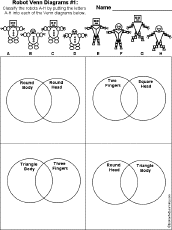 Robot Venn Diagram Printout #1 On this printout, the student classifies robots by placing them in Venn diagrams. Or go to the answers. |
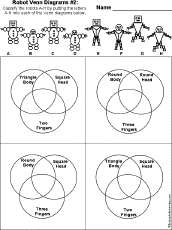 Robot Venn Diagram Printout #2 On this printout, the student classifies robots by placing them in Venn diagrams. Or go to the answers. |
Star Diagrams -- Ways to Make a Number:
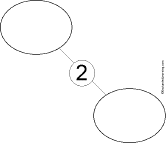 Two Ways to Make Two Find 2 ways to make 2 using arithmetic (like 1+1 or 4-2). |
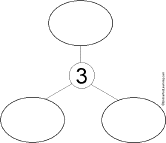 Three Ways to Make Three Find 3 ways to make 3 using arithmetic (like 1+2 or 1+1+1). |
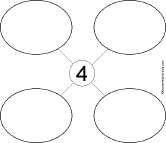 Four Ways to Make Four Find 4 ways to make 4 using arithmetic (like 1+3 or 1+1+1+1). |
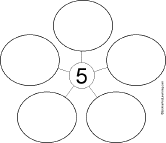 Five Ways to Make Five Find 5 ways to make 5 using arithmetic (like 2+3 or 1+1+1+2 or 7-2). |
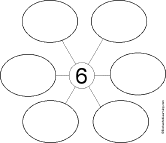 Six Ways to Make Six Find 6 ways to make 6 using arithmetic (like 3+3 or 7-1). |
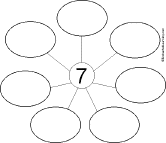 Seven Ways to Make Seven Find 7 ways to make 7 using arithmetic (like 3+4 or 8-1). |
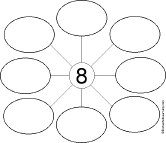 Eight Ways to Make Eight Find 8 ways to make 8 using arithmetic (like 4+4 or 9-1). |
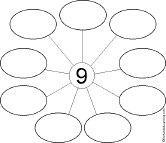 Nine Ways to Make Nine Find 9 ways to make 9 using arithmetic (like 5+4 or 10-1). |
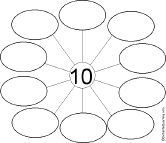 Ten Ways to Make Ten Find 10 ways to make 10 using arithmetic (like 6+4 or 11-1). |
Charts:
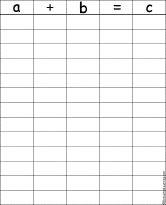 Addition Chart Write many equations in which a+b=c, like 3+1=4. |
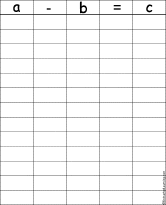 Subtraction Chart Write many equations in which a-b=c, like 3-1=2. |
 Multiplication Chart Write many equations in which axb=c, like 3x2=6. |
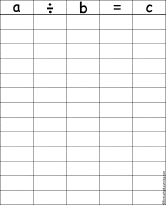 Division Chart Write many equations in which a÷b=c, like 6÷2=3. |
Printouts of Pie Charts (Circle Graphs):
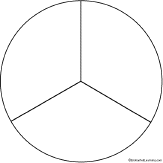 Pie Chart Printout 3 Divisions A pie chart with 3 divisions. Each division represents 33.3% of the circle graph. |
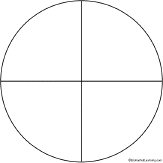 Pie Chart Printout 4 Divisions A pie chart with 4 divisions. Each division represents 25% of the circle graph. |
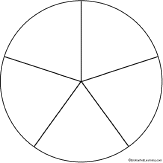 Pie Chart Printout 5 Divisions A pie chart with 5 divisions. Each division represents 20% of the circle graph. |
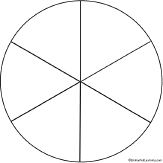 Pie Chart Printout 6 Divisions A pie chart with 6 divisions. Each division represents 16.7% of the circle graph. |
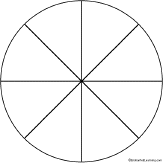 Pie Chart Printout 8 Divisions A pie chart with 8 divisions. Each division represents 12.5% of the circle graph. |
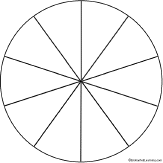 Pie Chart Printout 10 Divisions A pie chart with 10 divisions. Each division represents 10% of the circle graph. |
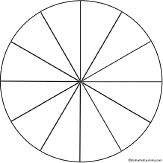 Pie Chart Printout 12 Divisions A pie chart with 12 divisions. Each division represents 8.3% of the circle graph. |
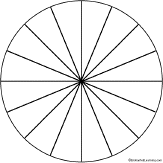 Pie Chart Printout 16 Divisions A pie chart with 16 divisions. Each division represents 6.25% of the circle graph. |
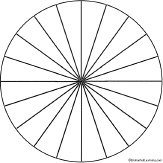 Pie Chart Printout 20 Divisions A pie chart with 20 divisions. Each division represents 5% of the circle graph. |
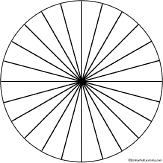 Pie Chart Printout 24 Divisions A pie chart with 24 divisions. Each division represents 4.17% of the circle graph. |
Enchanted Learning®
Over 35,000 Web Pages
Sample Pages for Prospective Subscribers, or click below
|
Overview of Site What's New Enchanted Learning Home Monthly Activity Calendar Books to Print Site Index K-3 Crafts K-3 Themes Little Explorers Picture dictionary PreK/K Activities Rebus Rhymes Stories Writing Cloze Activities Essay Topics Newspaper Writing Activities Parts of Speech Fiction The Test of Time
|
Biology Animal Printouts Biology Label Printouts Biomes Birds Butterflies Dinosaurs Food Chain Human Anatomy Mammals Plants Rainforests Sharks Whales Physical Sciences: K-12 Astronomy The Earth Geology Hurricanes Landforms Oceans Tsunami Volcano |
Languages Dutch French German Italian Japanese (Romaji) Portuguese Spanish Swedish Geography/History Explorers Flags Geography Inventors US History Other Topics Art and Artists Calendars College Finder Crafts Graphic Organizers Label Me! Printouts Math Music Word Wheels |
Click to read our Privacy Policy
| Search the Enchanted Learning website for: |